Changing the Rigs
I realized that one of the doubts of the IOM sailors is know when to make the exchange of rig. This exercise is just to get understand the math involved in solve this problem to increase the sensitivity on the time to change the rig. Knowing what is happening and help the intuition. The sail forces present here are not those of the real IOM sails and the boat heeled resistance is merely a presumption for us understand the physical aspects of the question. Of course, anyone with the real forces of the sails and the resistance value of the heeled boat for all angles will reach very close results to the real numbers.
We need to set some milestones for exchange the rig, for example:
a – Change rig when heel angle is constantly more than 30⁰.
Why this? Is to avoid a drastic decrease of lift and increased drag on the sails and allow no increase in drag on the hull due to deformation of the hull heel lines.
b – Change the rig only when the new rig is capable to develop all the force needed for the boat ride at full speed.
With boat’s graph resistance we can see the resistance for maximum velocity:
 Maximum resistance for Jegue is 0.200 kgf at 2.5 knot (max. IOM velocity) and we will supposing that at 30 degrees heel the resistance is 0.300 kgf and we will use this value independent of heel angle. Naturally if we have heeled resistance for all angles we can have a more accurate results.
With the necessary force to have our boat cruising in maximum velocity, 2.5 knot, we can go to the sail graph that give us the sail forces for each principals directions in function of wind velocity. This graph is characteristic of each sail, depend of point of maximum camber, camber value, sail area, sail dimensions, sail material, interference with hull geometry, etc. Our goal is know in what wind velocity the sail develop 0,200 kg in run and 0,300 kgf in hard, close, free, reach conditions (that are heeled boat conditions).
With the Rig 1 (minimum sail area) sail graph for developed force we have:
(I initiate with minimum area to know the influence in do the sails with maximum and minimum areas allowed by IOM rules, I will do some analyses)
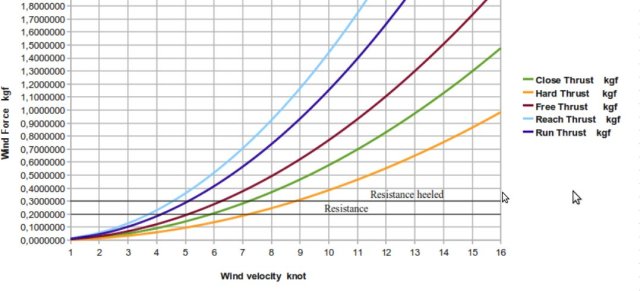 reach – 4.5 knot, run – 4.2 knot, free – 6.2 knot, close – 7.2 knot, hard – 8.7 knot
Now I know the wind velocity for each direction necessary for the sail furnish o.200 kgf in run and 0,300 kgf in the others directions.
The question now is: Will be that these wind velocities do not heel in excess our boat?
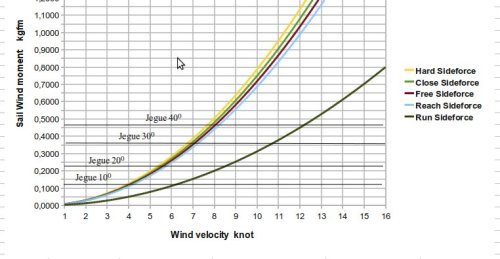
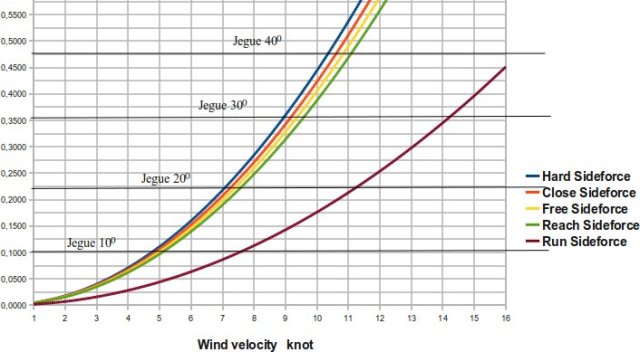
With these velocities and directions we can go to the sail heel moments graph, this graph tell us the heel moment do by sail in function of wind velocity, this moment will be submit to boat and the boat will heel, up to the Weight and Buoyancy boat forces do a righting moment that can equilibrate them. In this graph we can superpose the lines with the boat righting moments in any angle, that these two forces do, this information comes in the boat stability study, in this exercise we only put the moments lines for 10⁰, 20⁰, 30⁰ and 40⁰ :
The results are:
reach – 4.5 knot => > 10⁰
run – 4.2 knot => < 5⁰
free – 6.2 knot => > 20⁰
close – 7.2 knot => > 30⁰
( close 7.0 knot (below max boat velocity) = 29⁰ )
hard – 8.7 knot => > 40⁰
( hard – 7.0 knot (below max boat velocity) = 30⁰ )
By these data we can conclude, looking only for milestone a, that with winds more than 7 knot we can change the rig. Go to see Rig 2:
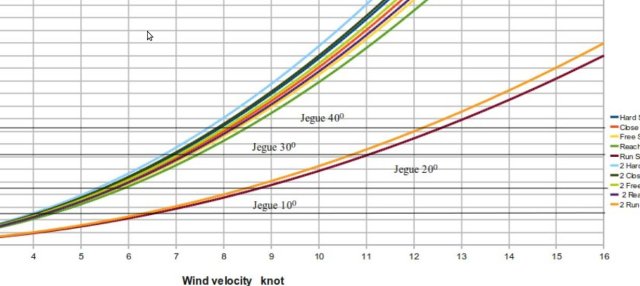
Done the same procedures above we have for RIG 2 Maximum area :
reach – 5.4 knot => 10⁰
run – 5.0 knot => 4⁰
free – 7.5 knot => 20⁰
close – 8.5 knot => 26⁰
hard – 10.5 knot => > 40⁰
hard 30⁰ = 9.0 knot
Well, seeing that, I would say that from 7.5 knots wind we should start thinking seriously about changing the rig because rig 2 is nearly able to develop the forces necessary to keep the boat at full speed (except in close and hard). What you think?
09/05/2010 – continuing
Done the same work with RIG 1Maximum Area we have:
Run – 4.1 knot => 5⁰
Reach – 4.4 knot => 13⁰
Free – 6.1 knot => 25⁰
Close – 7.0 knot => > 30⁰ (30⁰ = 6.7 knot)
Hard – 8.6 knot => > 40⁰ (30⁰ = 6.6 knot)
and we see that the difference between rig 1 max area and rig 1 minimum area is very little.
Consequently the same will occur with rig 2 and 3.
In function of this difference I will use in Jegue D’Água rig 1 minimum sail area as a result of her lesser beam (reduced stability). For rig 1 and 2 I will use the largest area.
Done the same procedures above we have for Rig 3 Maximum Area:
Reach – 6.6 knot => 8⁰
Run – 6.0 knot => 3⁰
Free – 9.1 knot => 16⁰
Close – 10.5 knot => 22 ⁰
Hard – 12,8 knot => >30⁰
Hard 30⁰ = 12.4 knot
From 10 knots I thought seriously about switching to the rig 3.
A good read on the subject:
http://www.lakesidemsc.org/library/files/f93b5533c2ed9f14e8841db026b83b6c-23.html#unique-entry-id-23
We need make clear that the gap between boat resistance upright and heeled do direct influence in these results, if we have a bigger gap naturally the conditions to do the rig exchange will be worst.
WHERE PUT THE MAST? Lowest possible?
This is another question that the peoples ask me.
Naturally, the lower is the CE, the center of gravity of the sail area, the smaller the lateral moment. But numerically, how much would this value?
By rule the shortest sail distance to the deck is 0.06m. Taking 0.02 for the boom and something under it, we can put the mast 0.04 under deck line (for boom can pass over deck). With this value I can change our spreadsheet and we have now this new graph for rig 1 minimum area moments:
Table 1 and 2 – With sails 0.06 m above deck line and with sail 0.02 m above deck line.
| V knots | V ft/sec | Hard Sidemoment | Close Sidemoment | Free Sidemoment | Reach Sidemoment | Run Sidemoment |
| 1 | 1,6890 | 0,0079 | 0,0075 | 0,0072 | 0,0069 | 0,0031 |
| 2 | 3,3780 | 0,0315 | 0,0300 | 0,0287 | 0,0275 | 0,0125 |
| 3 | 5,0670 | 0,0709 | 0,0675 | 0,0647 | 0,0618 | 0,0281 |
| 4 | 6,7560 | 0,1260 | 0,1200 | 0,1150 | 0,1100 | 0,0500 |
| 5 | 8,4450 | 0,1969 | 0,1875 | 0,1796 | 0,1718 | 0,0781 |
| 6 | 10,1340 | 0,2836 | 0,2699 | 0,2587 | 0,2474 | 0,1125 |
| 7 | 11,8230 | 0,3859 | 0,3674 | 0,3521 | 0,3367 | 0,1531 |
| 8 | 13,5120 | 0,5041 | 0,4799 | 0,4599 | 0,4398 | 0,2000 |
| 9 | 15,2010 | 0,6380 | 0,6074 | 0,5821 | 0,5566 | 0,2531 |
| 10 | 16,8900 | 0,7876 | 0,7498 | 0,7186 | 0,6872 | 0,3124 |
| 11 | 18,5790 | 0,9530 | 0,9073 | 0,8695 | 0,8315 | 0,3780 |
| 12 | 20,2680 | 1,1342 | 1,0798 | 1,0348 | 0,9896 | 0,4499 |
| 13 | 21,9570 | 1,3311 | 1,2672 | 1,2144 | 1,1614 | 0,5280 |
| 14 | 23,6460 | 1,5438 | 1,4697 | 1,4084 | 1,3469 | 0,6124 |
| 15 | 25,3350 | 1,7722 | 1,6871 | 1,6168 | 1,5462 | 0,7030 |
| 16 | 27,0240 | 2,0164 | 1,9196 | 1,8396 | 1,7593 | 0,7998 |
| V knots | V ft/sec | Hard Sidemoment
|
Close Sidemoment | Free Sidemoment | Reach Sidemoment | Run Sidemoment |
| 1 | 1,6890 | 0,0074 | 0,0070 | 0,0067 | 0,0064 | 0,0029 |
| 2 | 3,3780 | 0,0296 | 0,0281 | 0,0270 | 0,0258 | 0,0117 |
| 3 | 5,0670 | 0,0665 | 0,0633 | 0,0607 | 0,0580 | 0,0264 |
| 4 | 6,7560 | 0,1183 | 0,1126 | 0,1079 | 0,1032 | 0,0469 |
| 5 | 8,4450 | 0,1848 | 0,1759 | 0,1686 | 0,1612 | 0,0733 |
| 6 | 10,1340 | 0,2661 | 0,2533 | 0,2428 | 0,2322 | 0,1056 |
| 7 | 11,8230 | 0,3622 | 0,3448 | 0,3304 | 0,3160 | 0,1437 |
| 8 | 13,5120 | 0,4731 | 0,4504 | 0,4316 | 0,4127 | 0,1877 |
| 9 | 15,2010 | 0,5987 | 0,5700 | 0,5462 | 0,5224 | 0,2375 |
| 10 | 16,8900 | 0,7392 | 0,7037 | 0,6744 | 0,6449 | 0,2932 |
| 11 | 18,5790 | 0,8944 | 0,8515 | 0,8160 | 0,7804 | 0,3548 |
| 12 | 20,2680 | 1,0644 | 1,0133 | 0,9711 | 0,9287 | 0,4222 |
| 13 | 21,9570 | 1,2492 | 1,1892 | 1,1397 | 1,0899 | 0,4955 |
| 14 | 23,6460 | 1,4488 | 1,3792 | 1,3218 | 1,2640 | 0,5747 |
| 15 | 25,3350 | 1,6631 | 1,5833 | 1,5173 | 1,4511 | 0,6597 |
| 16 | 27,0240 | 1,8923 | 1,8014 | 1,7264 | 1,6510 | 0,7506 |
With these data the difference at 30 ⁰ is 0.3 to 0.4 knot to achieve the inclination, however, as will the behavior of the wind with a lowered deck, will change the sail behavior?
Naturally with all little gains added we can have a better performance, the problem is that we can not do a preview, without measures in water. Indeed I think that many things thought as certain may not have the exact value assigned to them.
Go to comments!








Pingback: Footy Tipping Spreadsheet Afl | AFL Footy Tipping
HI,
The 7 knot value for an A rig is close to my own estimates, however because the wind is usually so variable in practice the decision on rigs is commonly made on whether the boats nosedive when running in the peak gusts. Observations and caculations suggest this occurs in the 11 knot range at model yacht level, higher if measured on the bank. For more detail see http://www.radiosailingtechnology.com.
Thanks for an informative and interesting blog!
Hi,
Thanks, your blog is very informative and interesting also.
Come forward looking for explanations, mathematical predictions, etc..
Cheers
Fred
Pingback: Footy Maths Problems | AFL Footy Tipping
Pingback: Footy Maths | AFL Footy Tipping
Pingback: 2010 in review |